

@Yowster laid out the full method in the forum, and the results since then are on the SteadyOptions performance page: nine closed bullish combos, seven winners, and nearly every winner closed at its roughly 10% target. The two losses were AMD at −2.1% and JPM at −14.5%.
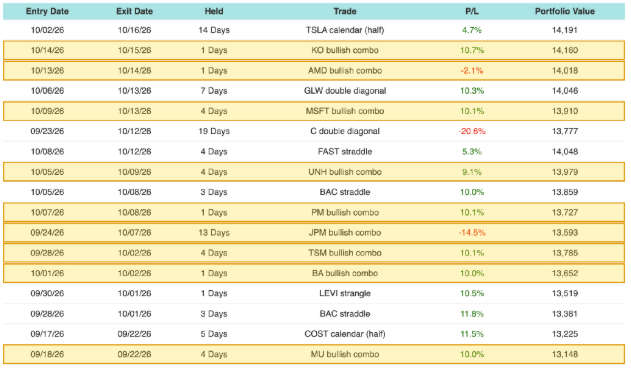
Figure 1. The nine bullish combos on the SteadyOptions performance page (highlighted), September 18 through October 15. Source: steadyoptions.com/performance.
@yowster’s write-up uses three EarningsStudy screens to build each trade. The last of them, the GEX page, is the one I want to look at closely here. It has an As Of slider that replays the page on any past date, so we can ask a simple question of every trade: what did the gamma map show on the evening before entry? And did that picture help, mislead, or not matter?
Three screens, three questions
The method in @yowster’s post answers three questions in order, and each one lives on a different screen.
Has this setup worked on this stock before? The Daily Screener answers it with an exit rule and a hit count. Set the rule to take profit at +15%, and each cell shows how many prior cycles hit that target from that entry day. The GOOGL example showed 7 of 7, and the same screen on October 19 still shows 7 of 7 on the long-call rows.
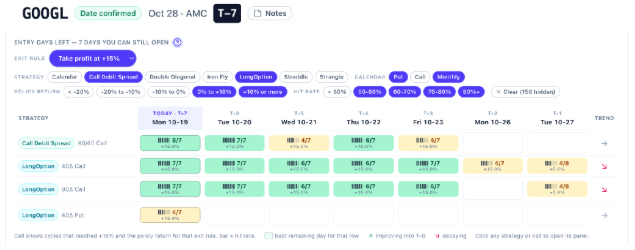
Figure 2. The Daily Screener for GOOGL with the exit rule set to take profit at +15%, filtered to Call Debit Spread and LongOption. Each cell shows how many prior cycles reached +15% from that entry day. Captured October 19, 2026 (T-7 before the October 28 report).
Is the move the trade needs a normal one? The Long Stock Trend chart shows the stock’s path into the report for every prior cycle, with the median drawn in black and the macro calendar (CPI, PPI, FOMC) marked on the axis. If the combo needs a 4% rise, you can see at a glance whether that is routine for this name or a stretch.
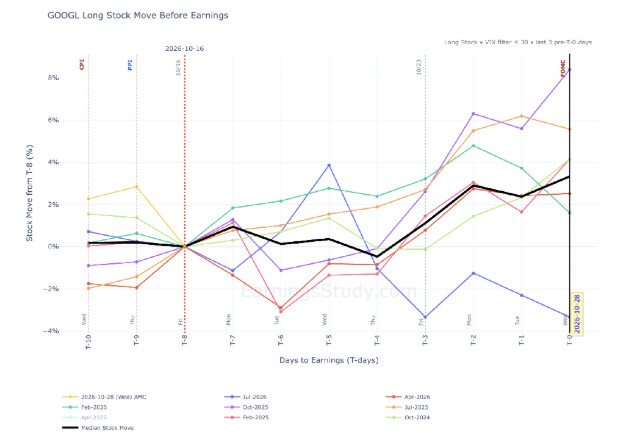
Figure 3. The Long Stock Trend chart for GOOGL. Each colored line is one prior cycle measured from T-8; the black line is the median path; macro events are flagged along the top.
How is the trade built? @yowster construction, in brief: a call debit spread with the long strike at or slightly above the money, plus a narrower put debit spread with the long strike a little below the money, roughly two-thirds the width of the call side. All legs use the earnings-week expiration and the trade closes before the report. He keeps the total cost below the width of the put spread, targets about 10%, and expects most losses to stay under 10%. For his GOOGL example, the P&L chart showed that a rise of a little under 4% would reach the 10% target, which is exactly what the trend chart above lets you check.
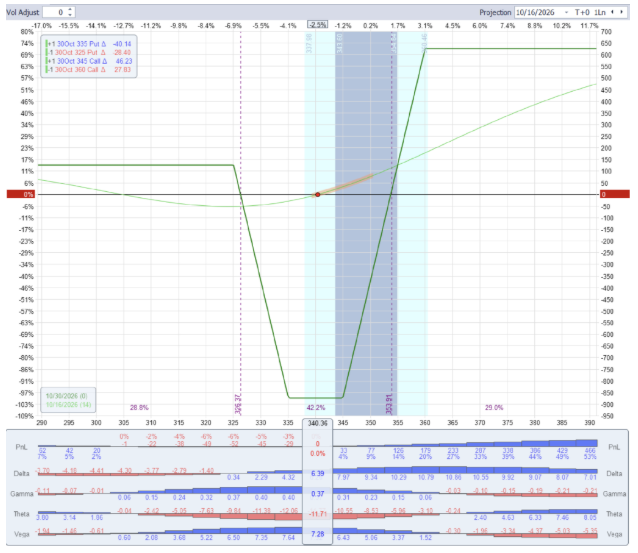
Figure 4. Yowster’s GOOGL bullish combo as published in his forum post: +1 335 put / −1 325 put / +1 345 call / −1 360 call, October 30 expiration, $8.70 debit. Reproduced with Yowster’s permission.
What does the options market’s positioning look like right now? That is the GEX page, and it is the subject of the rest of this article.
What the GEX page measures
Market makers who sell options hedge them with stock, and how they hedge depends on their gamma. Net GEX adds up that gamma exposure across the whole option chain, in dollars per 1% move in the stock.
When net GEX is positive, the usual reading is that dealer hedging leans against the move: they buy dips and sell rips. Price tends to be stickier and pullbacks shallower. When net GEX is negative, hedging tends to push in the same direction as the move, so moves extend whichever way they start. The page labels the two regimes “Positive gamma” and “Negative gamma.” It also marks the gamma flip, the price where the regime changes, and the call and put walls, the strikes carrying the most call-side and put-side gamma.
We read the Net GEX label as a quick sentiment check. Since the combo’s main risk is a drop, a backdrop where dips tend to get cushioned is the one you want. Three caveats matter, and the page states them. The data is end-of-day. Open interest reflects positions as of the prior close. And the sign of each contract’s gamma is a model assumption about who is short what, because the data carries no trade direction. The page describes the terrain. It does not forecast.
Nine trades, replayed
For each combo I set the As Of slider to the last close before the entry date, which is what a trader would have had in hand the night before. Here is what the page showed.
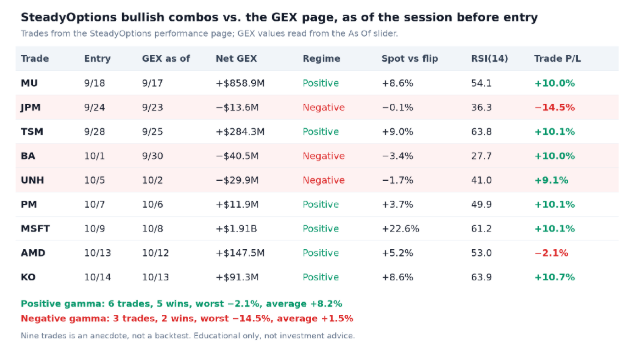
Figure 5. Each SteadyOptions bullish combo with the GEX page reading from the session before entry. Trade results from the SteadyOptions performance page.
Six of the nine trades were entered in positive gamma. Five of those won, and the one loss was AMD’s −2.1%. Three were entered in negative gamma. Two of those won, and the third was the biggest loss of the run, JPM’s −14.5%. Averaged per trade, the positive-gamma entries returned +8.2% and the negative-gamma entries +1.5%.
Two things stand out.
Negative gamma is not the same as bearish. BA and UNH both entered with the stock below the flip, and both made 9–10% within a few days. BA had an RSI of 27.7, it sat right on its 185 put wall, and it bounced hard. Negative gamma amplifies moves in both directions, which is exactly why the outcomes there were so spread out. Two clean wins and one deep loss is what a wider distribution looks like.
A positive headline can hide a weak floor. AMD was entered in positive gamma and still lost. That case deserves a closer look.
AMD: the cushion was lower than the headline (Screenshots from EarningsStudy)
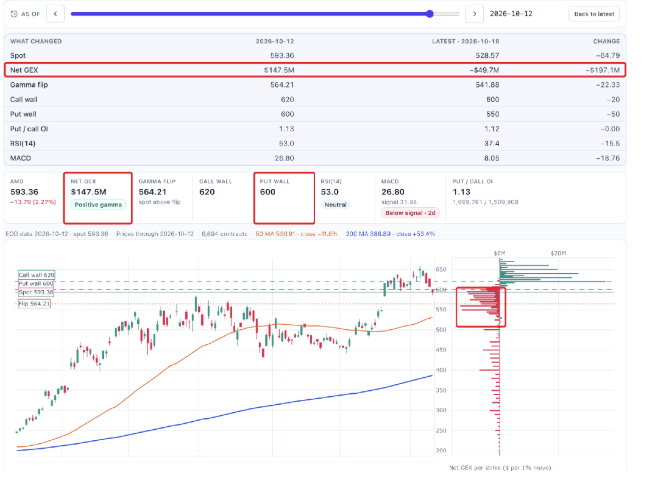
Figure 6. AMD as of October 12. The headline reads positive gamma, but spot had slipped below the 600 put wall and the per-strike bars directly under it are red. The What Changed panel shows the regime four sessions later.
On October 12, AMD’s headline read +$147.5M, positive gamma, with spot 5% above the flip. But the per-strike profile on the right tells a more detailed story. The positive gamma sat above the stock, around the 620 call wall. The strikes below spot were negative, and spot at 593 had already slipped under the 600 put wall. The positive total came from above the price; underneath it, there was no cushion.
The What Changed panel shows how that played out. By October 16, spot had fallen almost $65 and net GEX had swung by −$197M into negative territory. The combo was already closed by then, at −2.1%, because the put spread hedge did its job. As a lesson in reading the page, AMD says to look past the headline sign: check where the stock sits relative to the put wall, and whether the bars directly underneath it are green or red.
JPM: below the flip and below the wall (Screenshots from EarningsStudy)
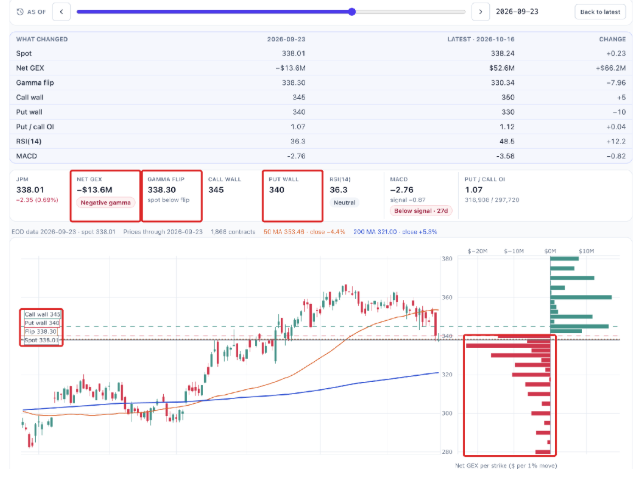
Figure 7. JPM as of September 23. Negative gamma, spot sitting on the flip and below the 340 put wall, every per-strike bar beneath the stock red, MACD below its signal line for 27 sessions, and price 4.4% under its 50-day average.
All three negative-gamma entries had the stock below the flip. JPM was the only one where it had also broken below its put wall. Net GEX was −$13.6M with spot on the flip line itself, the per-strike bars underneath were all red, and the MACD had been below its signal line for 27 sessions. BA and UNH, by contrast, were each sitting just above their put walls when they bounced. JPM was also held 13 days, the longest of the nine; none of the others ran past four. Steady Options contributor’s own notes flag that risk: losses grow when a trade stays open a long time and RV bleeds out.
None of this means the page “called” JPM. Three trades can’t establish a pattern, and BA and UNH won from the same regime. What JPM shows is what a weak floor looks like on this page: no positive gamma underneath the stock and no wall holding it. When you see that, it’s reasonable for position size or entry timing to reflect it.
MSFT: what a clean backdrop looks like (Screenshots from EarningsStudy)
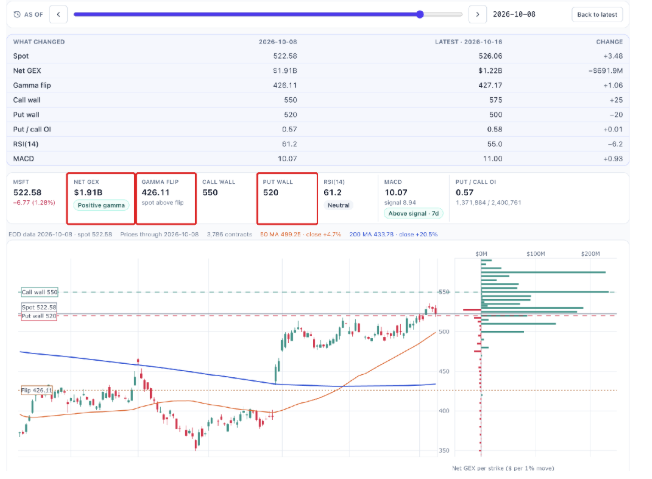
Figure 8. MSFT as of October 8: +$1.91B net GEX, spot 22.6% above the flip, holding just above the 520 put wall with mostly green bars underneath, MACD above signal for seven sessions.
For contrast, MSFT on October 8 showed the textbook picture: a large positive net GEX, the flip far below at 426, spot sitting just above its put wall with mostly green bars stacked underneath, and momentum confirming. The combo hit its target in four days.
How to use this, and what it can’t tell you
Nine trades is an anecdote. This is not a backtest. It is a replay with hindsight, and two of the three negative-gamma trades won. What the replay supports is narrower and more useful than a filter: the GEX page tells you what kind of ground you are standing on. In positive gamma, losses in this run stayed small. In negative gamma, the outcomes spread out in both directions.
If you want to add it to the bullish-combo checklist, here is the order I’d use, following method:
- History first. On the Daily Screener, check the hit rate for your exit rule at your entry day.
- Reachability. On the Long Stock Trend chart, check whether the move your P&L chart needs is a normal one for this stock.
- Backdrop last. On the GEX page, read the regime, then the distance from spot to the flip, then where spot sits relative to the put wall and whether the bars just under it are green or red. Use the As Of slider and the What Changed panel to compare with a few sessions earlier. As AMD showed, a regime can change within days, and a weakening trend reads differently from one that has held steady for weeks.
The point of putting these on one platform is that each answers a different question, and none of them is enough alone. A strong hit rate with negative gamma under the stock is a different trade from the same hit rate with a green cushion beneath it. The combo structure Yowster built already limits the damage when the stock drops. These screens help you see when that protection is likely to be tested.
Credit where it’s due: the bullish combo, its strike rules and its use of these screens are Yowster’s work; his GOOGL P&L chart is reproduced with his permission. His original post is in the SteadyOptions forum under “Earnings Bullish Combo Trade Strategy.” All trade results are from the SteadyOptions performance page.
SO members on the All-services bundle: full core access to EarningsStudy is free through the partnership. Sign in at earningsstudy.com with your SteadyOptions email.
EarningsStudy provides educational research and market information only, not investment, financial or trading advice. GEX values are model estimates from end-of-day data, and dealer positioning is inferred, not observed. Options trading involves substantial risk. Past results do not guarantee future results.