

The iShares 20+ Year Treasury Bond ETF (TLT) continues its strong freefall, reaching its lowest level since September 2023 as cracks in the bond market accelerated. TLT plunged to $77, down 11% this year and 46% in the last five years. Despite all this, investors have continued to buy the dip.
TLT ETF inflows rise despite weakness in the bond market
The iShares 20+ Year Treasury Bond ETF has been in a freefall this year and is now at the lowest level in years. Despite all this, investors have continued to allocate capital to the fund.
ETF Db data shows that the fund had over $2 billion in inflows in the last month, bringing the six-month figure to $8.6 billion. It has had over $3.6 billion in net inflows this year, bringing its assets under management to over $46 billion.
The smaller Vanguard Long-Term Treasury ETF (VGLT) has also had inflows this year. It has added $370 million in inflows in the last 30 days and by $1.4 billion in the last six months.
These ETFs have added assets despite the turmoil in the bond market. The 30-year yield has gone parabolic and is trading at 5.67%, its highest level since May 2002. It has been in an uptrend after bottoming at 0.725%. Similarly, the ten-year yield soared to 5.33%, its highest level since 2002.
There are several reasons why bond yields are rising this year. One of them is the fact that US public debt has jumped this year. After crossing the $40 trillion mark in July, it has now jumped to $40.225 trillion, and the trend will continue.
A surging public debt is not necessarily a bad thing, especially if the economy is growing. The challenge, however, is that the economy is not growing substantially this year. Estimates are that the economy will grow by between 2% and 3%, driven by the ongoing AI investments.
The bond market is also cracking because of the ongoing US-Iran war, which has led to a surge in energy prices. Gasoline and diesel prices have continued rising, with the latter hovering around its all-time high.
Government bonds are also competing with top companies like Meta Platforms, Microsoft, and Amazon that are raising billions of dollars to fund their data center rollout.
TLT technical analysis
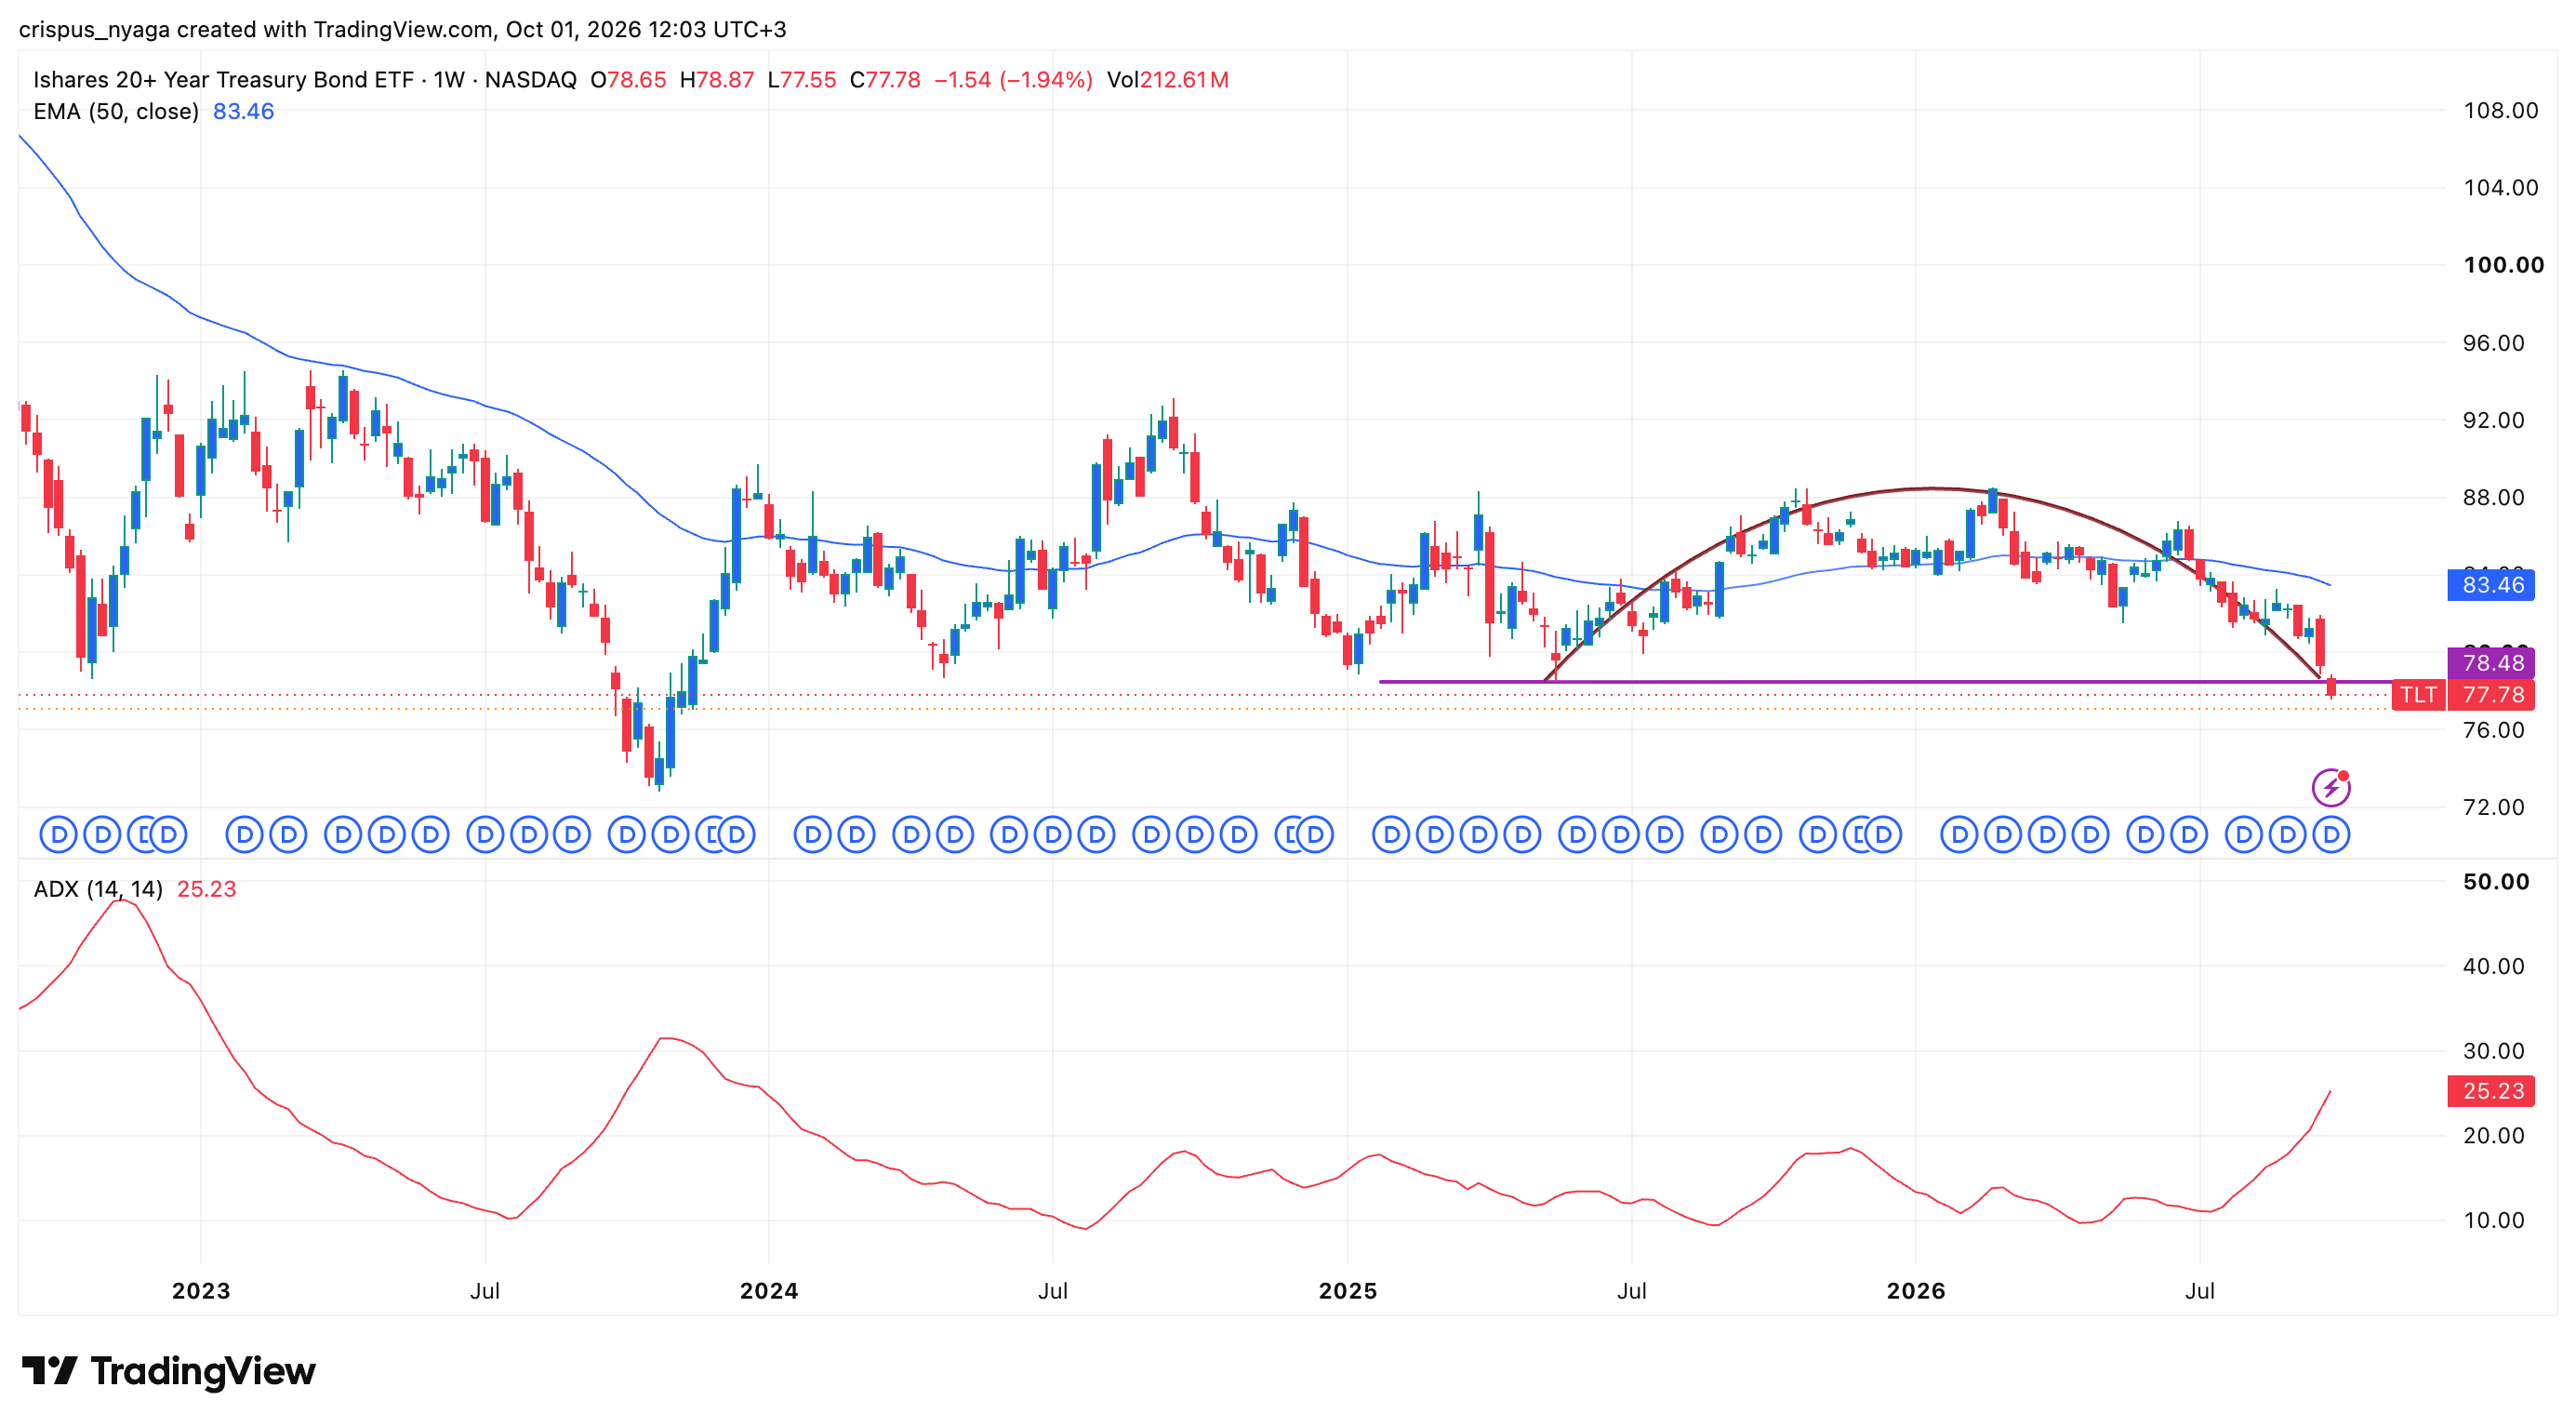
TLT ETF chart | Source: TradingView
Technicals suggest that the TLT ETF has more downside to go. It has already crashed below the important support level of $78.48, its lowest level on May 19. This support was the lowers side of the inverted cup-and-handle pattern, a common continuation sign.
The ETF remains below the 50-week and 100-week Exponential Moving Averages (EMA), while the Average Directional Index (ADX) has jumped to 25, its highest level since December 2023. A rising ADX indicator is a sign that an asset is gaining momentum.
Therefore, the path of least resistance is downwards, potentially to the psychological level of $75. On the flip side, a jump above the resistance level of $79 will invalidate the bearish outlook.
The post TLT ETF analysis: US Treasury yields and inflows jump appeared first on Invezz