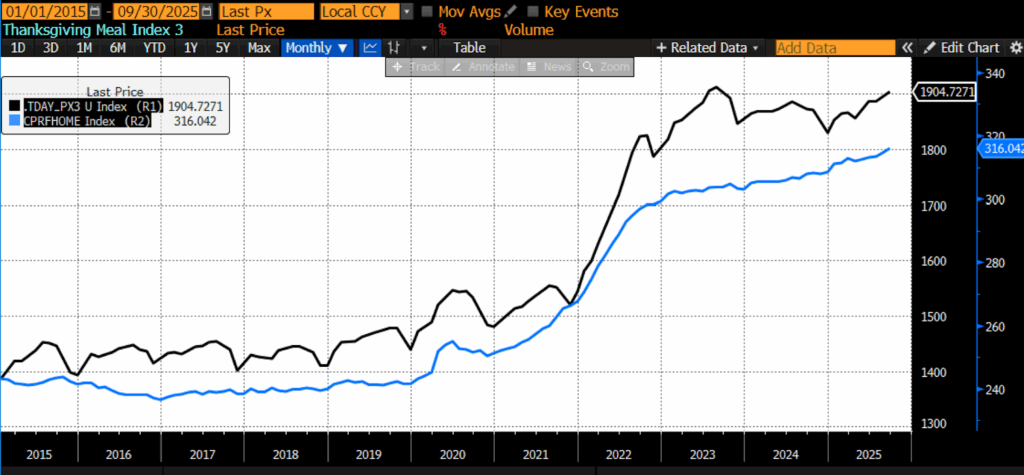
The 2025 Thanksgiving season arrives with an unwelcome development: after last year’s brief and much-needed period of easing in several Thanksgiving staples, prices have begun to tick back up. As of September 2025, the AIER Thanksgiving Cost Index stands at 1904.72, less than half of one percent from its all-time high of 1912.30 (2023). Food inflation overall is still cooler than in the early 2020s, but the downward drift seen in 2023–2024 has clearly reversed across most components of the holiday meal. The federal shutdown has complicated matters by halting the release of October CPI data, forcing analysts to rely on September figures and private-sector estimates, yet even the incomplete dataset shows a broad reacceleration. What had looked like the early stages of a sustained normalization now appears to have been only a temporary pause, and the modest but widespread increases recorded this year point to a cost structure that remains stubbornly elevated rather than steadily improving.
The latest AIER Thanksgiving Cost Index (TCI) points to roughly a 3 percent increase from November 2024 through September 2025: almost exactly in line with broader food-at-home inflation. This gentle climb contrasts sharply with the explosive 2021–2022 surge that pushed the index up about 17 percent in a single year, yet it also stands in clear contrast to last year’s temporary dip. Categories such as canned fruits (+6.2 percent), frozen bakery products (+2.2 percent), frozen vegetables (+1.7 percent), and turkey and other poultry (+3.0 percent) all swung from mild deflation last year to renewed increases this year. Retailers and producers are no longer battling shortages or bottlenecks, and promotions are more common than during the height of the supply-chain crisis, but those improvements have not translated into continued price declines. Instead, the 2024–2025 pattern represents a re-acceleration from last year’s deflationary interlude – modest increases replacing what now looks like a fleeting episode of relief.
| Nov24 – Sep25 (%) | Nov23 – Nov24 (%) | Nov22 – Nov23 (%) | Nov21 – Nov22 (%) | Nov20 – Nov21 (%) | |
| CPI Bread | 1.2 | -0.8 | 3.7 | 15.7 | 4.0 |
| CPI Canned Fruits | 6.2 | 0.2 | 1.9 | 20.9 | 0.0 |
| CPI Frozen and Refrigerated Bakery Products | 2.2 | -2.8 | 2.0 | 19.4 | 6.5 |
| CPI Frozen Vegetables | 1.7 | -1.4 | 6.1 | 18.3 | 0.5 |
| CPI Turkey and Other Poultry | 3.0 | -1.9 | 5.0 | 17.9 | 4.6 |
| CPI Sauces and Gravies | 1.7 | 1.1 | 8.0 | 13.7 | 3.3 |
| CPI Potatoes | 11.4 | -2.0 | 0.8 | 16.2 | -0.2 |
This year’s modest price increases have also generated political claims that merit clarification. Former President Donald Trump has repeatedly asserted that Thanksgiving costs are “way down” and that Walmart’s advertised Thanksgiving basket is “25 percent cheaper than one year ago,” citing the retailer’s annual promotion as evidence of broad price declines. But these statements, widely circulated on the campaign trail, rely on a non-comparable, pared-down basket: Walmart’s roughly $40 meal deal achieves a lower headline price by adjusting item counts and portion sizes rather than reflecting genuine market-wide deflation. Fact-checkers have pointed out that grocery prices overall are still rising — food-at-home inflation is running near 3 percent — and that the “25 percent cheaper” claim is misleading without acknowledging the redesigned basket. In short, retail promotions do not substitute for underlying inflation data, and the official numbers show a return to mild price increases rather than a sustained move lower.
| Nov24 – Sep25 (%) | Nov23 – Nov24 (%) | Nov22 – Nov23 (%) | Nov21 – Nov22 (%) | Nov20 – Nov21 (%) | |
| CPI Food at Home | 2.6 | 1.6 | 1.7 | 12.0 | 6.4 |
| AIER Thanksgiving Cost Index | 2.9 | 0.2 | 3.4 | 17.5 | 2.5 |
This shift is especially striking because the 2023–2024 period brought what appeared to be genuine stabilization. Frozen bakery products, frozen vegetables, bread, and turkey all showed mild declines last year, providing welcome respite after the intense price pressures of previous years. But the declines were short-lived. Nearly every major Thanksgiving category is back in positive territory this year, underscoring how deeply embedded the structural drivers of food costs have become. Energy, processing, packaging, transportation, and labor costs remain elevated; even where supply conditions have normalized, the price floor has not returned to pre-pandemic levels.
Long-run data confirm the extent of the shift. Cumulative price increases (calculated since early 2020) remain substantial:
- Turkey and Other Poultry (+38.6 percent)
- Canned Fruits (+35.5 percent)
- Sauces and Gravies (+35.1 percent)
- Potatoes (+21 percent).
These categories remain structurally expensive because their underlying cost drivers — fertilizer and feed costs, energy-intensive processing, persistent poultry disease pressures, and higher post-pandemic labor and logistics expenses — have not retreated enough to undo the past four years’ inflation. Even with last year’s declines, turkey prices are still far above their historical norms, and recurring avian influenza outbreaks continue to constrain supply.
The shutdown-induced absence of October CPI data injects unusual uncertainty into this year’s analysis. Without the month that typically anchors holiday food-price assessments, economists have turned to private-sector trackers to gauge October and early November conditions. Most show continued moderation in broad food-at-home categories, along with a mix of small declines and increases across Thanksgiving components — consistent with the slight but widespread upward drift seen in the official September data. When BLS backfills or combines the missing data later this year, the trendlines will become clearer, but for now the picture is incomplete.
Even with that gap, the post-pandemic arc is increasingly clear. Pre-2020 Thanksgiving prices were generally stable or drifting downward in categories like frozen vegetables, bakery items, and turkey. The 2020–2022 period brought an extraordinary supply shock marked by pandemic disruption, fertilizer spikes, freight constraints, soaring energy prices, and repeated poultry disease outbreaks. The 2023–2024 period delivered a short phase of relief as bottlenecks dissipated and yields improved. And now, the 2024–2025 readings suggest a new phase: stability mixed with renewed upward movement. The deflationary pause has ended; the inflationary surge has not returned; what remains is a plateau of high but not rapidly rising prices.
AIER Thanksgiving Cost Index vs. US CPI Food-at-home (2015 – 2025)

Overall, the 2025 Thanksgiving Cost Index describes a holiday environment that feels more stable than the tumultuous early 2020s but still more expensive than Americans were accustomed to before the pandemic. Prices this year are up modestly, the brief declines of last year have reversed, and the long-term structural cost build-up remains firmly in place. For consumers, the result is a holiday meal that is more predictable but still historically costly. For policymakers, it is a reminder that the economic effects of expansionary monetary policy, trade intervention, and supply shocks persist long after headline inflation cools — sometimes reasserting themselves just when they appear to be fading.