In January 2024, The University of Chicago Harris School of Public Policy and the Associated Press-NORC Center for Public Affairs Research published a survey that found two-thirds of Americans believed their taxes were too high and they lacked confidence in how the federal government spends their tax dollars.[1] These sentiments are not unfounded. This Explainer will cover where the government takes revenue from, how it spends those dollars, how it prioritizes spending, and what’s projected for the future.
Where Does the Money Come From? Where Does the Money Go?
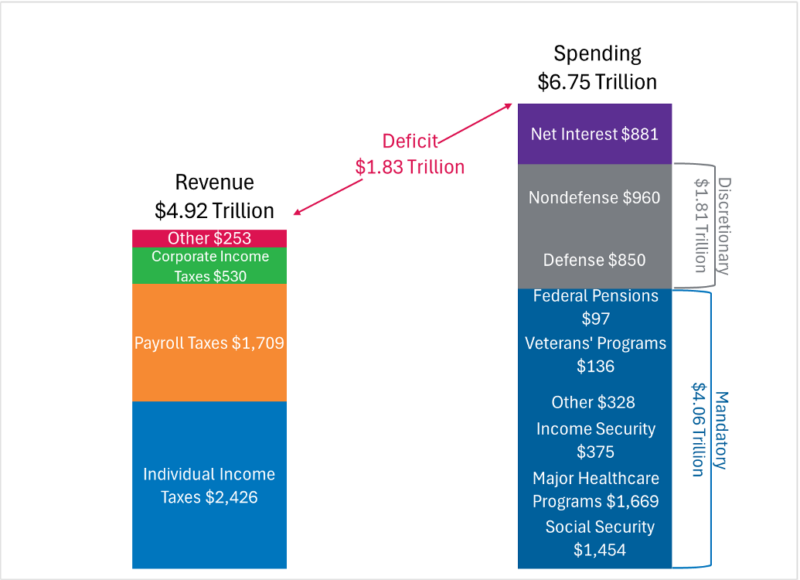
Over the course of Fiscal Year (FY) 2024 (October 1, 2023-September 30, 2024), the federal government took in $4.92 trillion in tax revenue and spent $6.75 trillion. Figure 1 shows the recreation of “Federal Revenue vs Spending” full breakdown of federal revenues and expenditures by source for FY 2024.[2]

As Figure 1 shows, 84 percent of that revenue comes right out of your paycheck between individual income taxes and payroll taxes (such as funding for Social Security and Medicare). Another 10 percent comes from taxes on business income. The remaining 5 percent “Other” category consists of excise taxes, remittances from the Federal Reserve, customs duties, estate and gift taxes, and miscellaneous fines and fees.[3]
When observing the spending column, notice three distinct categories: Mandatory Spending, Discretionary Spending, and Net Interest Spending. Here is how the federal government distinguishes these categories:
- Mandatory Spending: This is spending that is mandated by existing laws. This category includes entitlements such as Social Security, the major health care programs (Medicare, Medicaid, CHIP, and the “Affordable Care Act Tax Credits & Related Subsidies”). It also includes income security programs such as the Temporary Assistance for Needy Families (TANF) and the Supplemental Nutrition Assistance Program (SNAP). The Other category includes spending on higher education, agriculture, deposit insurance, the Department of Defense, Fannie Mae and Freddie Mac, the Pension Benefit Guaranty Corporation, and the Education Stabilization Fund.[4]
- Discretionary Spending: This is spending that is formally approved by Congress and the President during the appropriations process (when Congress designates and approves spending for the fiscal year) each year. Discretionary spending is broadly divided into defense and nondefense spending for federal agencies and programs during the appropriations process. During the fiscal year, the federal government can also issue supplemental appropriations in the same manner. The most recent notable examples of this are the massive spending bills the federal government issued in 2020 in response to the COVID-19 economic downturn.[5]
- Net Interest: This is the interest costs on the national debt minus interest income that the government receives on loans (such as student loans) as well as cash balances and earnings of the National Railroad Retirement Investment Trust.[6]
Mandatory spending makes up most federal expenditures, accounting for $4.06 trillion (over 60 percent) of all federal spending in FY 2024. The three largest mandatory spending programs are Social Security totaling $1.454 trillion (36 percent of mandatory spending and 21 percent of total spending), Medicare with $1.09 trillion (28 percent of mandatory spending) and Medicaid and CHIP at $575 billion (15 percent of mandatory spending). It is also important to note that spending on net interest ($870 billion) now exceeds both Medicaid and CHIP spending and total defense spending ($850 billion). According to CBO estimates, the only categories that exceed net interest spending are Social Security, the major health care programs (Medicare, Medicaid, CHIP, and ACA Tax Credits & Related Subsidies), and discretionary nondefense spending.
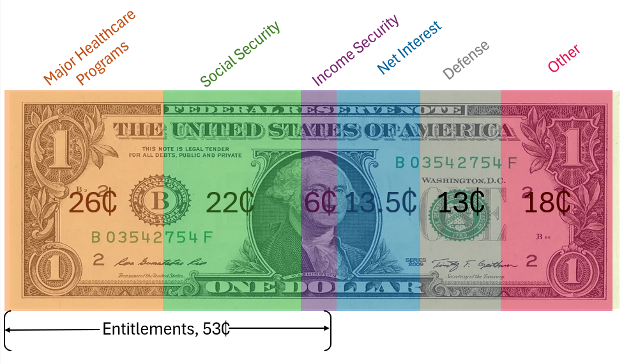
Figure 2 frames the issue differently by showing how each tax dollar is spent. For each dollar the federal government spends, more than half of that dollar goes toward entitlement spending. This dispels the myth that significant cuts to defense spending could be used to fund entitlements. As of FY 2024, net interest payments on the national debt exceed national defense spending. Net interest payments also eclipsed spending on all major health care programs except Medicare.
Underlying all of this is the fact that the federal government is spending more than the revenue it is bringing in, leading to massively growing debt. The problems with growing debt are discussed extensively in the AIER Explainer Understanding Public Debt.[7] In essence, as investors lose confidence in the federal government’s ability to pay its debts, they’ll ask for higher interest rates (a higher price of borrowing). As this continues, spending on net interest will continue to crowd out other spending categories. This means the average American will see higher taxes, a weaker dollar, reduced access to credit (as the US government diverts capital out of the private sector to finance deficits), and fewer public services.
How Government Prioritizes Spending
To understand how the government allocates funds, it is important to first consider the incentives (rewards and punishments that motivate behavior) of government officials. Regarding elected officials, economist Thomas Sowell famously noted that their two most important priorities are getting elected and getting reelected. Any subsequent goals are less important than the first two.[8] As for unelected government officials, economist William Niskanen noted that their success is measured by the number of people working under them and the size of their discretionary budget.[9]
It is also important to examine the constraints government actors face. In order for any money to get spent, Congress and the President have to agree to spend it. This results in logrolling, where these elected officials are willing to offer concessions to the other side in exchange for a desired policy in return.[10] No one gets everything they want, but everyone gets something. It is also important to note that bureaucratic funding is zero-sum, meaning that funds not allocated to one agency are being spent on a different agency. This constraint on unelected officials incentivizes them to ask for spending increases and encourages “mission creep,” where bureaucrats expand their agency’s role beyond its intended scope to justify increased funding.
Logrolling, however, can result in voter confusion. If voters notice their representative engaging in logrolling often enough, the elected official may come off as unprincipled, which could result in him or her losing reelection. Unfortunately, the more government increases its scope of authority, the more logrolling will occur, resulting in greater voter confusion.
These elected officials, however, will not just cater to any voters. They will listen to the voters who can help sway the election in their favor. These tend to be smaller groups with a shared interest. These groups can either be in the private sector or bureaucrats in the public sector. These small groups have a greater stake in getting the policy outcomes they want compared to the wider public whose interests are more widely distributed. Their size also allows them to politically organize, mobilize, and easily police free riding. This allows these groups to concentrate benefits for themselves and disperse the costs among the wider populace. [11]
In conclusion, elected officials will focus on the interested parties that show up and can impact their electoral prospects. This can lead to spending priorities that favor these groups regardless of whether those priorities are the best use of taxpayer dollars.
Future Projections
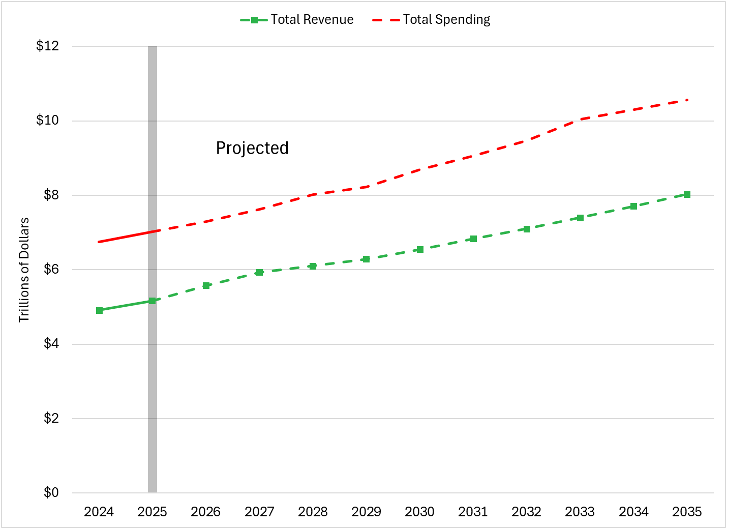
Unfortunately, the levels of spending and incentive problems do not bode well for Americans. Figure 3 shows the CBO’s projections, which show that (assuming all else remains equal) spending will continue to rapidly outpace revenues over the next decade.
To tackle this issue, policymakers will need a combination of fiscal and regulatory reforms. This will limit how much money the government can take as well as limit what it can pass along to citizens as unfunded mandates. As my colleague Dave Hebert and I wrote,
“We should not just seek to starve the beast of resources. We need to starve the beast of responsibility. Rather than turn to government, as citizens are increasingly wont to do, we need to understand that private markets are much more powerful at solving society’s ills than they are commonly understood to be.”[12]
In 2025, bond investors continue to demand higher premiums for US government debt. This means that policymakers in Washington must prioritize spending cuts or else suffer the consequences of crippling public debt.
References and Resources for Further Information
[1] AP-NORC Center for Public Affairs Research. (January 2024). “Majorities view local, state, and federal taxes as too high and delivering too little value for people like them” https://apnorc.org/majorities-view-local-state-and-federal-taxes-as-too-high-and-delivering-too-little-value-for-people-like-them
[2] “Federal Revenue vs Spending (For Fiscal Year 2023, in Billions).” Federal Budget in Pictures from The Heritage Foundation. Created July 24, 2024. Accessed July 29, 2024. https://www.federalbudgetinpictures.com/federal-revenue-vs-spending/
[3] “The Budget and Economic Outlook: 2024 to 2034.” Congressional Budget Office. February 7, 2024. Accessed July 24, 2024. https://www.cbo.gov/publication/59710
[4] Ibid.
[5] “How much has the U.S. government spent this year?” America’s Finance Guide from FiscalData. U.S. Department of the Treasury. https://fiscaldata.treasury.gov/americas-finance-guide/federal-spending/
[6] “Net Interest” in A Glossary of Terms Used in the Federal Budget Process. Congressional Budget Office. Accessed July 24, 2024. https://www.cbo.gov/publication/42904
[7] Savidge, Thomas and Yonk, Ryan M. Understanding Public Debt. American Institute for Economic Research. 15 Aug 2024. Accessed 1 Jan 2025. https://aier.org/article/understanding-public-debt/
[8] Sowell, Thomas. “Politicians solve their problems, not yours.” The East Bay Times. 25 November 2009. Accessed July 24, 2024. https://www.eastbaytimes.com/2009/11/25/thomas-sowell-politicians-solve-their-problems-not-yours/
[9] Niskanen, William A. “The Peculiar Economics of Bureaucracy.” American Economic Review. Vol 58, No 2 (May 1968). p. 293-305. Accessed July 24, 2024. https://www.jstor.org/stable/1831817
[10] Buchanan, James M. and Tullock, Gordon. The Calculus of Consent: The Logical Foundations of Constitutional Liberty. Indianapolis: Liberty Fund. Accessed July 24, 2024. https://www.econlib.org/library/Buchanan/buchCv3.html?chapter_num=11#book-reader
[11] Shugert, William F. “Public Choice.” Econlib Concise Encyclopedia of Economics. Accessed July 24, 2024. https://www.econlib.org/library/Enc/PublicChoice.html
[12] Hebert, David and Savidge, Thomas. “Learning Fiscal Discipline: Colorado’s Success, Shortcomings, and Regulatory Ruse.” The Daily Economy by the American Institute for Economic Research. 17 Dec 2024. Accessed 21 Jan 2025. https://thedailyeconomy.org/article/learning-fiscal-discipline-colorados-success-shortcomings-and-regulatory-ruse/